NodePing's Status Reports provide a flexible and powerful way for you to display information about your checks, both for public status reporting and for internal use on private views. There are two main components to status reporting:
Both of these reports are highly configurable, making them a very flexible way to display the specific information you want. In addition to the customization options discussed below, we also have information on styling the reports.
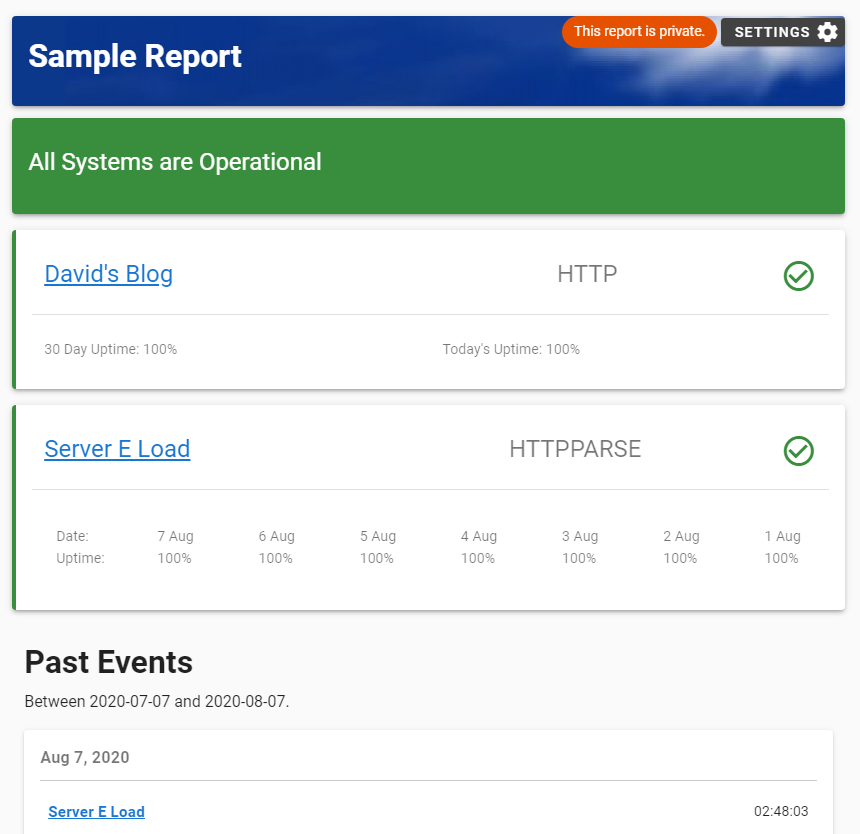
Both the Status Report and Check Status pages have several components that you can choose to display, or leave off. This includes information about the current state of the check (up or down), uptime in a variety of formats and time frames, result history (for individual checks), event history, and custom notes.
Both of the reports also allow you to set styling, directly adding CSS to the page. This gives you control over the look of the page, to fit with your branding and style. You can configure a banner and footer area, and add custom blocks with support or other information for your customers.
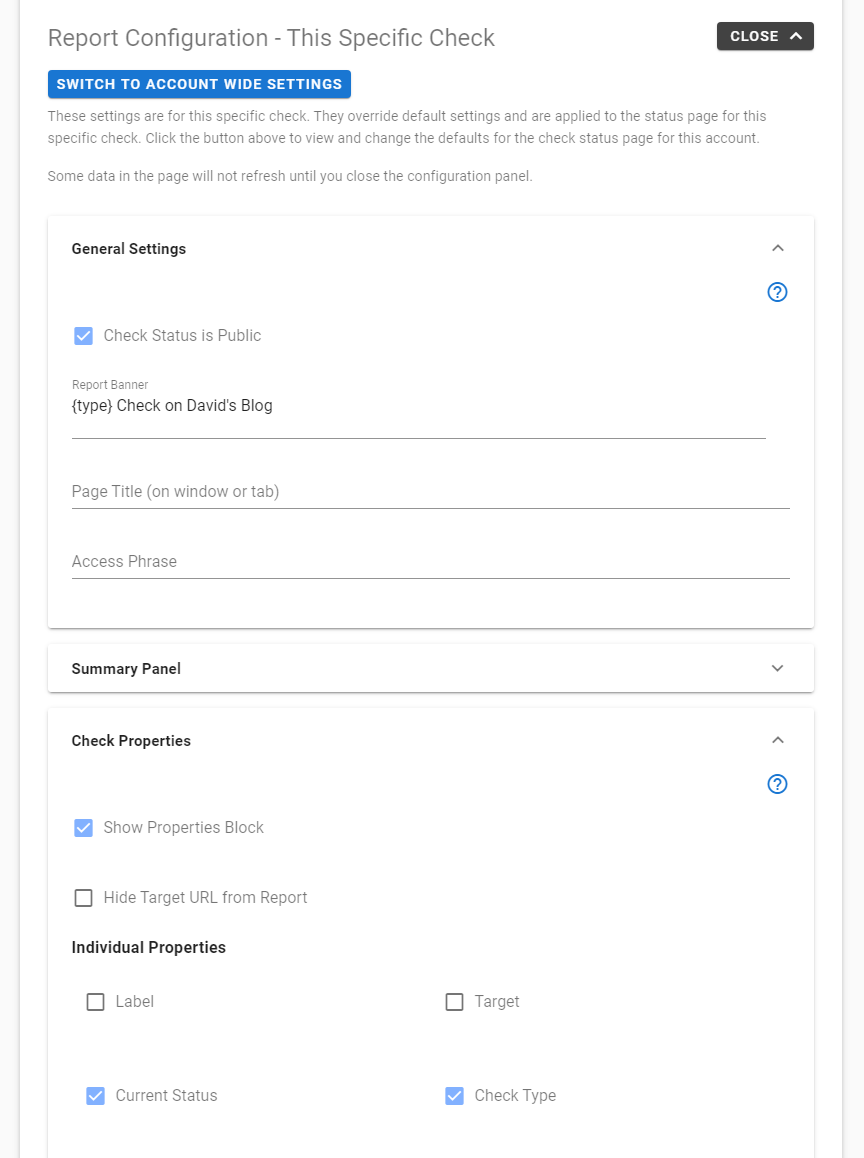
Public or Private Reporting - Both of these status views can be set to public or private, and default to private. A private report can be seen by anyone who has a login to your NodePing account. You can also leave notes that are private, even on an otherwise public report.
You can add multiple status reports to your account, and configure each of them individually. The number of status reports you can add depends on your plan, but all of our plans include at least five status reports. The reports are listed, and you can add additional reports, in your account under Account Settings - Reporting.
You can configure your public status reports to be presented on your own custom domain (example: status.example.com) and most plans include free SSL certificates for those reports.
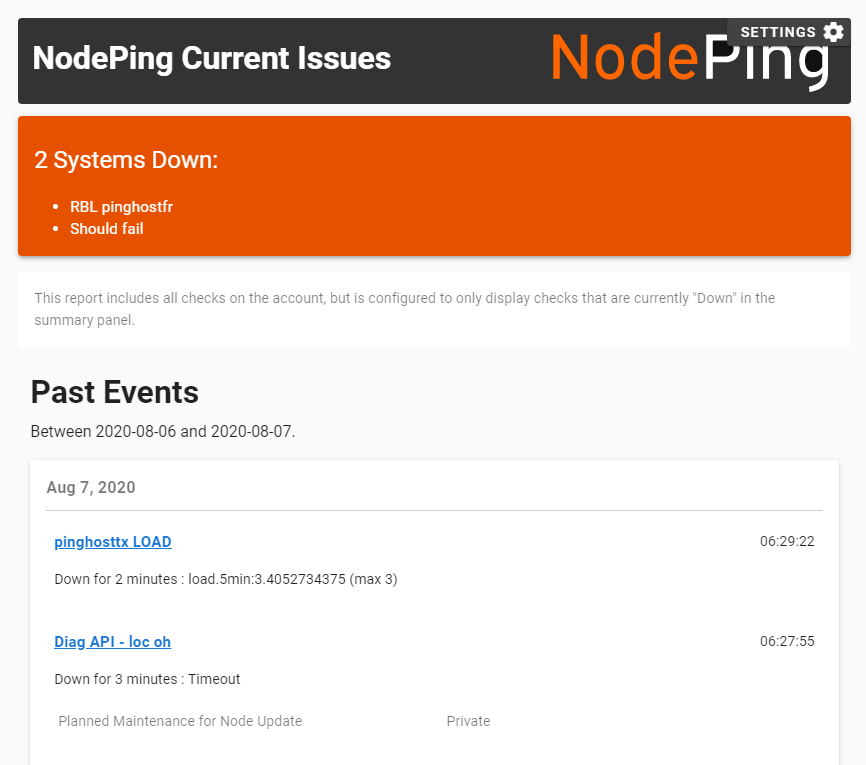
This section allows you to show a summary of the checks that are up or down. You can use the CSS controls to adjust colors for these blocks. The summary text can be customized, and can optionally show which checks are down, with links to the individual check reports.
You can add any of the checks from your account to each Status Report, and customize what information is displayed on the report about each check. The report can either show all of the checks configured for the report all of the time, or only those that are enabled, and/or only the ones that are "down." Or, you can leave off this section altogether, and just show which checks are "down" in the Summary Overview described above. Checks can be sorted (drag them around while the settings panel is open), and can be individually customized with a custom label, given individually set views of uptime information, optionally show the check description field, and optionally given a link to the check's individual status page with more details.
The Events area is intended to show incidents and allow you to provide updates to your customers about maintenence and other events that impact your services. You can select how much history to show, and how much to load at a time. You can set it to show all days with a customized message when there were no events for a given day, or just show the days that had events. This area can also show notes that you created on the Check's status page, which can be set to be public or private.
Every check on your account automatically has a status page, which you can configure to either be public or private. You can set how these pages will appear for your account by default, and then configure each check's page specifically for that check as well. The page can be used to show information about the check properties, results history, uptime, and event history (including diagnostics information). As with the Status Report discussed above, each of the components on the Check Status pages can be shown or removed from your reports.
You can set the page to show the properties for the check, including the label, description, target, current state, and so on. Each of these fields can be toggled to show or not.
You can choose to show the uptime for this check, and configure what time frame and how this information will be displayed. Options for uptime include showing current state, today's uptime, seven days, or thirty days of uptime in a variety of formats. Uptime can also be shown visually as a gauge rather than just as a number.
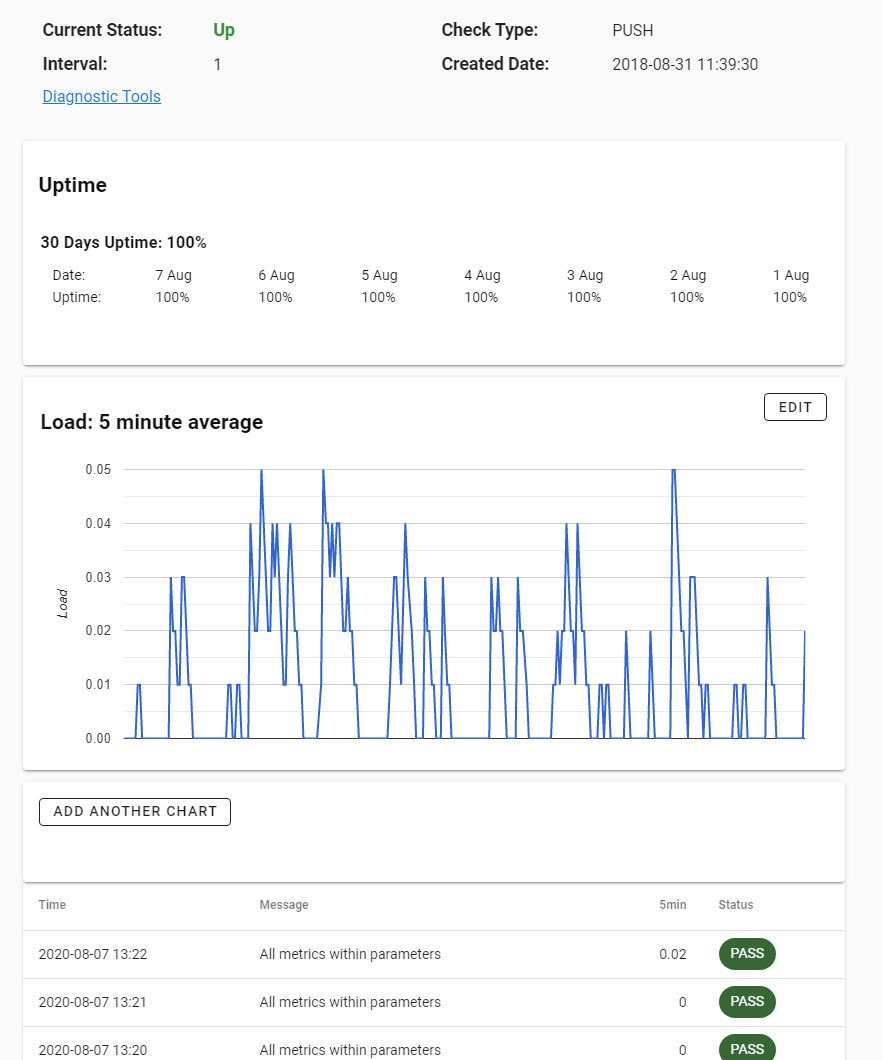
Graphs - In its basic form, this is used to graph the response time on your HTTP or PING checks. But this report can show multiple graphs of the check results, which you can add and customize to fit your needs. For HTTP Parse and PUSH checks this is particularly useful, because you can show graphs for specific components of the results. For example, we use this to graph system load on servers, memory utilization. At NodePing we use PUSH and PARSE checks to graph how many checks overall are in our system in different states, and how many notifications we're currently sending out of different types, which are useful for us to quickly see when there are potential problems in our overall distributed systems. Basically, any numeric value you push into a PARSE or PUSH check is potentially a graph on this report.
Result detail - You can list the individual results for the check. Customize which fields to show, depending on your specific use case. For PUSH and PARSE checks, the extended fields you set up on your check are available here as well.
You can also allow your users to set how many results to show on this view.
This is the event history displayed on the Status Report and discussed above, here specific to this check. You can configure how much history to show, whether to show days without events or just days with incidents, and how much information to fetch at a time. For each event on the list, you can add a note, and mark each note to be private (visible to users on your account) or public. If you use our diagnostics tools, historical information about diagnostics for this check will also be visible to users on your account here.

 Documentation
 Development
 Premiere
 Check Types