Information about the results of the monitoring are available in a variety of formats tailored to a variety use cases.
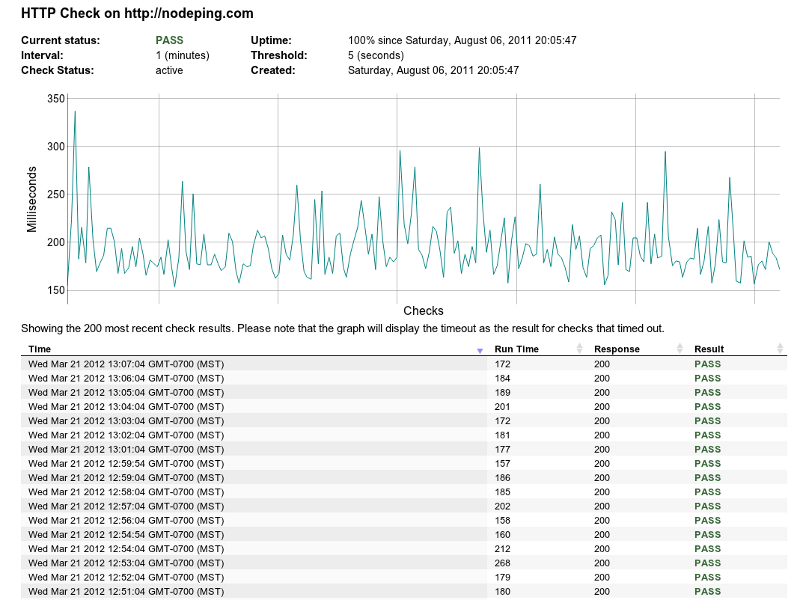
The main screen's list of checks displays whether that check is currently in a PASS or FAIL state. If you click on the words PASS or FAIL, you can see a chart and list of the most recent results for that check.
You can view all notifications that have been sent for each monitoring check by clicking on the "List Notifications." This shows what notifications have been sent, to whom, and what they said. Generally the last month or so of notifications are visible in this list.
The results report shows the most recent results for the check, very similar to the results view discussed above.
Every check is assigned a UUID that is used in the URL's for the reports. The report URL also lets you easily set how many results you want to return by adding / and an integer after the UUID. See the examples below to see how that looks.
This report accepts URL parameters for start and end dates. In most cases, the end date is more useful than start, since the report returns a set number of records sorted by time backwards from that date (in database talk, sorted by date descending). The format for the date is fairly flexible, we'd recommend using YYYY-MM-DD. See the URL examples below.
 There are also three different ways to get the results of this report. The default is a standard HTML view, as shown in the screenshot. There are links to each format in the main status screen, but you can also change the URL's by hand to adjust the output. Adding a "format" parameter to the URL allows you to change the results to a JSON or CSV format. Changing to CSV causes the browser to treat the report as a download. To set the file name for the download, just append /filename to the URL, where filename is whatever you want to name the file (typically it should end in .csv).
URL examples:
The performance summary report shows the minumum, maximum, and average response time over an hour. By default, it shows 31 days of data. Like results report, you can change the number of results shown by editing the number on the report's URL. You can also retrieve the data in JSON or CSV format by adding ?format=csv or ?format=json to the URL. For CSV output, you can add a file name to the URL as well for convenience (so the URL would end in /filename.csv?format=csv).
URL examples:
The uptime report shows the amount of time that the check has been enabled, how much it has been down, and an uptime percentage. Uptime is calculated based on the time that the check is enabled, so if a check is disabled for a while it does not count against uptime.This report accepts parameters:
As with the other reports, you can also retrieve the data in JSON or CSV format by adding ?format=csv or ?format=json to the URL. For CSV output, you can add a file name to the URL as well for convenience (so the URL would end in /filename.csv?format=csv). Unlike the other reports, this report does not accept a limit number. The start and end date serve a similar purpose.
URL examples:
Each check has a toggle in its configuration that allows you to turn on "public" reports for that check. Once public, the results, uptime, and summary reports can be accessed using the UUID without needing a login to the account. Note that the UUID is not easily guessable, and we do not publish them. Therefore, while the report is public in the sense that it does not require a login, it will not be readily accessible by anyone who doesn't know the UUID. The public toggle turns all of the reports for that check on or off. At present you can't just turn public access to the summary without turning it on for the results report as well.
In addition to the public reports that are available for each check, there is also a public status report that can show the status and uptime for some or all of your checks on a public page. The report shows the uptime for each check over the last 30 days, as well as the uptime for each of the last seven days. You can see a sample of this report at https://status.nodeping.com. This report can be enabled for your account and managed under Account Settings -> Reporting.
Once enabled, the report has a generic URL at which it can be accessed, which is shown near the top of the report configuration page. You can optionally give the status report a custom domain, often something like "status.example.com". To use a custom domain, in addition to entering it in the report configuration, you'll also need to point the domain in your DNS to nodeping.com so people can reach the report in their browser. Usually a CNAME record is the best way to accomplish this.
The report also allows you to set the report title. Since this field allows HTML, you can add styling to this to make it match your brand. In fact, it is possible to add an image tag (such as your logo) and a style tag to this field and use it to customize the look of the report as a whole. Not all tags are supported, but the custom title feature gives you a significant amount of control over the styling of the report.
You can set which of your enabled checks will appear on your status report by clicking the checkbox under the "Include" column. If a check has its public reports enabled, the status page will automatically have a link from the check name on the status report to the check's specific report.
The "Show Check Type" field allows you to toggle whether the report should include a column showing the check type.
The charts used throughout the site provide some features to understand and view the data better. If you move the mouse over the line in the chart, you'll see the time and result for that time for that point on the chart. This allows you to easily see the details of the results more clearly. You can also zoom in to see the data more closely by dragging either horizontally or vertically on the chart. Double clicking returns you to the default scale.